
Object Navigator Widget
Object Navigator Tabs
The widget has two tabs,
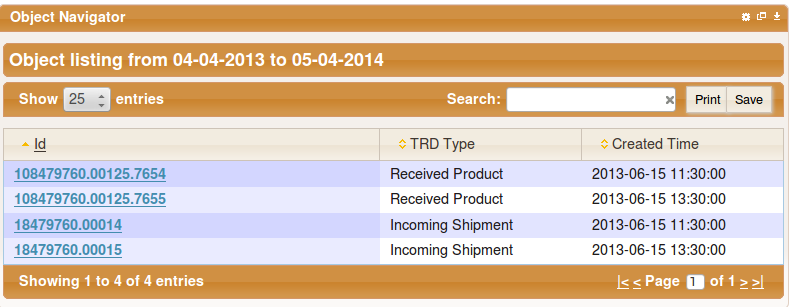
- Search & List
- Object Details
Note
- The Entity Type column in the Object Detail is by Default hidden. To View the column, Enable it in Widget Configuration
- All dates in the widget, for example, the Created Time column (shown above) display the date in the date format that has been set in User Preference
Search & List tab
This tab provides a listing of available objects and a search box to find epc Ids
Example of a searched ID( It also accepts partial IDs)
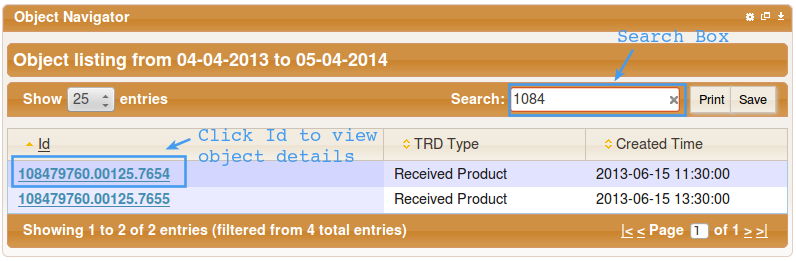
On clicking of the Id value in the rows opens Object details with the details of the clicked ID value
Object Details
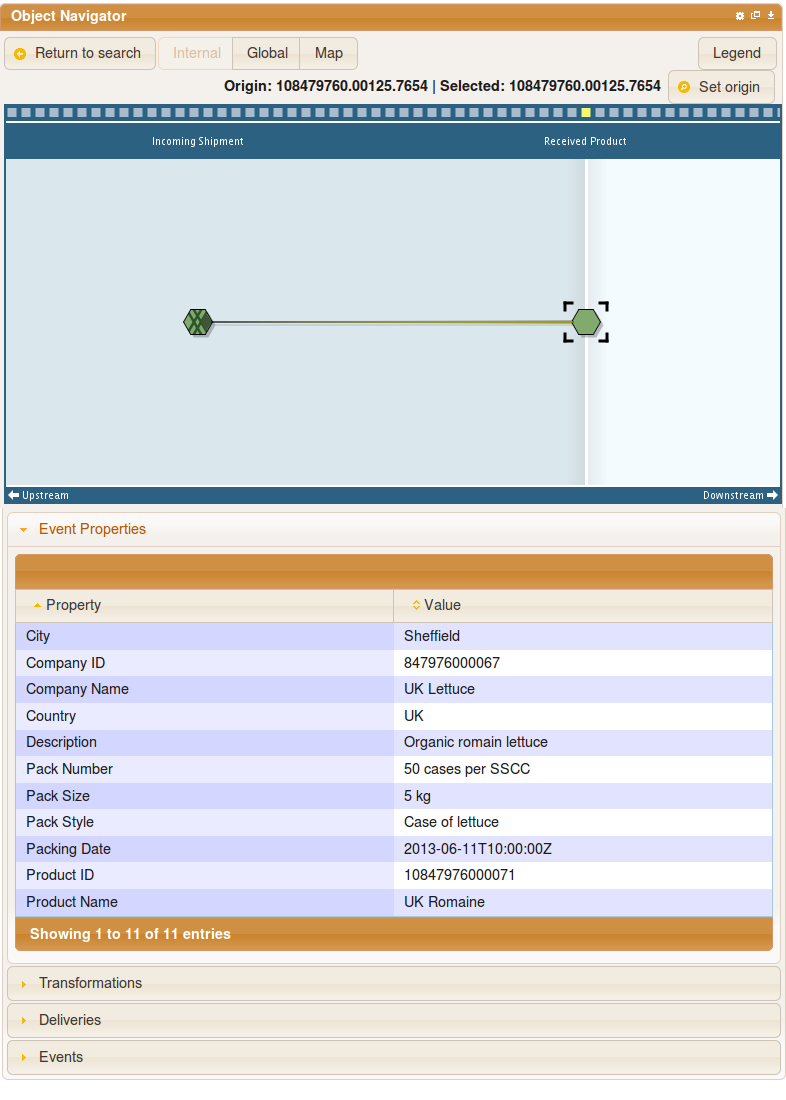
Object Details Sections
Graph Section
Viewing the widget in normal and maximized widget mode will reload the widget and re size
the graph as well as the tables to fit to the widget.
Note
To go back to the Search View, Click the Return to Search button.
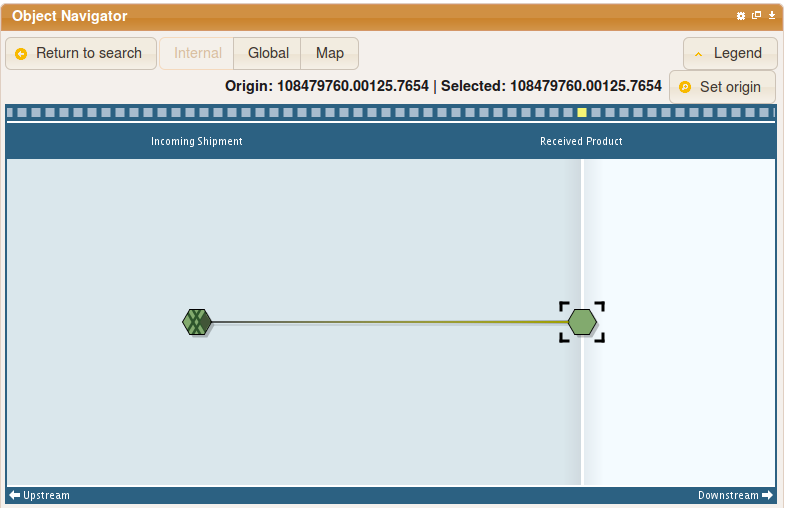
Graph interactions
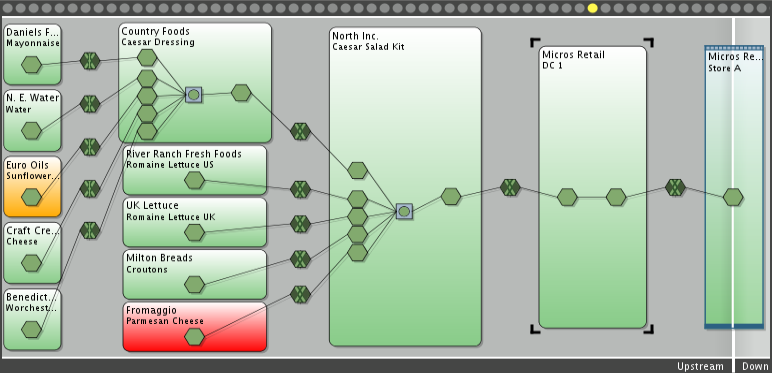
- The internal option loads a local traceability graph and the details for the selected Id as seen above
- The global option provides a trade unit traceability graph and the details for the selected Id as seen below
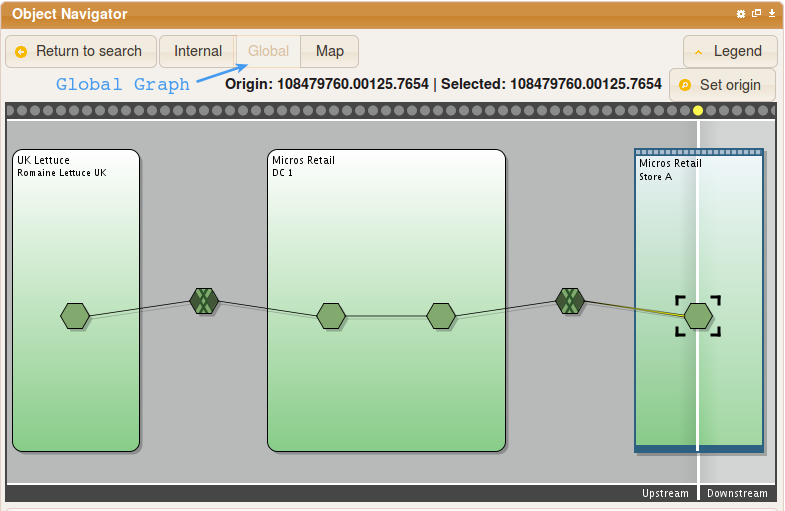
Note
Clicking on any icon will change the focus of the graph to the icon selected and change the information tables below with details of the new object selected. the selected: label is also updated.
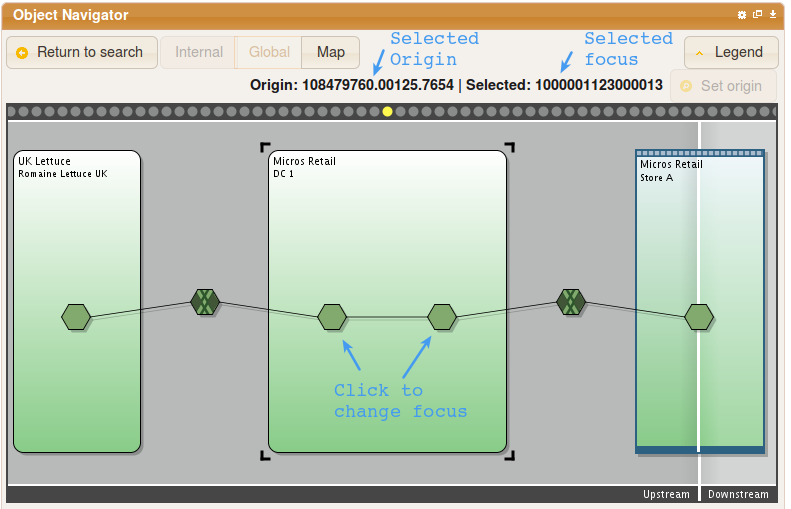
Note
Click on the Set Origin button changes the origin of graph to the focused icon.
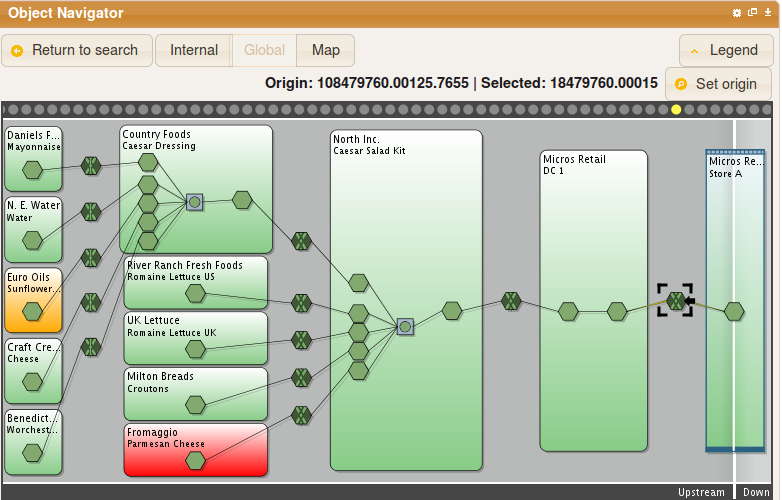
Global Graph
- On the global graph, Clicking on any node displays Organizational information, and master data if available See below.
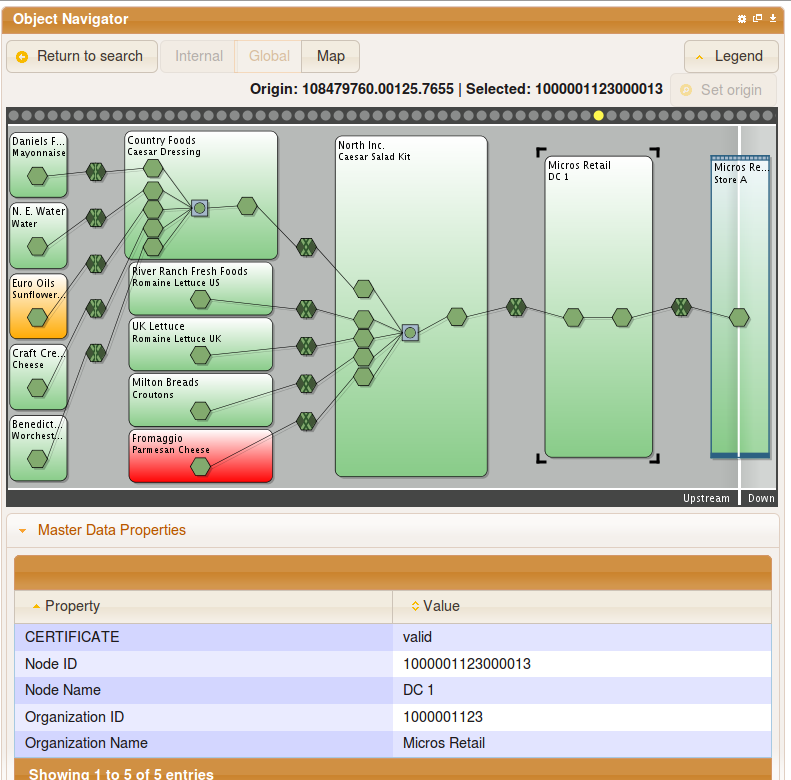
Graph Highlight Organization attributes
Some graphs may be configured per organization to provide organization box highlighting according to some master data attribute value
In this case the attribute is "certificate"
- When certificate is valid the organization will show as green highlight
- When certificate is invalid the organization will show as red highlight
- When certificate is expired the organization will show as orange highlight
Contamination Trace Reports
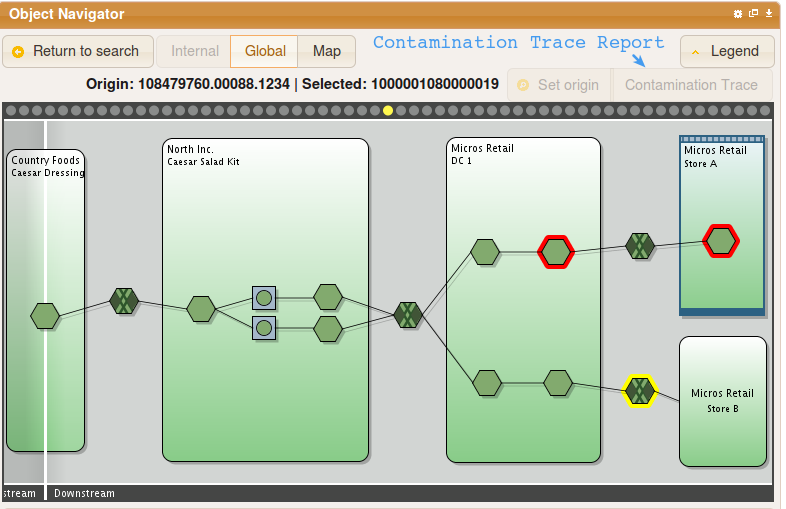
The Contamination Trace button only becomes visible when you click on a trade unit / batch on a remote node as shown below.
To generate a traceability report on a trade unit you suspect is contaminated. Use the following steps:
- Click on the trade unit you suspect to be contaminated.
- Make it the new origin by clicking on the Set origin button
- Change focus to a trade unit in a remote node then click the Contamination Trace button.
Note
The contamination trace feature is not available for downstream trade units / batches
Map
To view the organizations that took part in the processing of a trade unit, click on map you will be presented a map that that displays the locations of various organizations on a map.
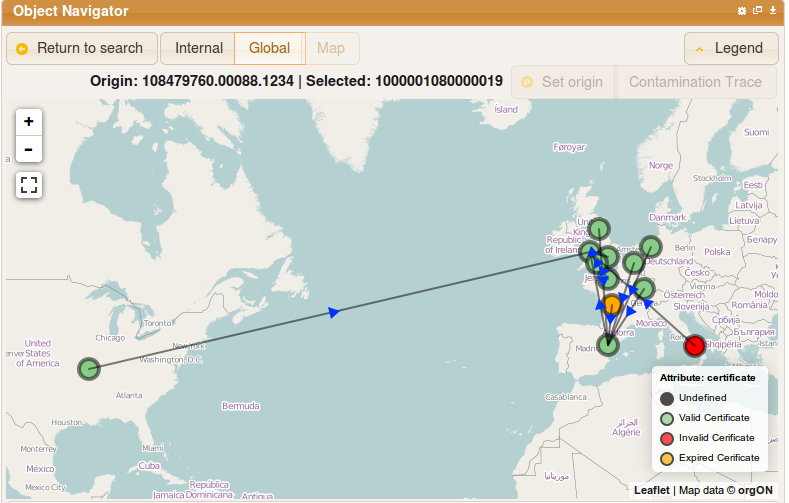
The circles on the map represent an organization and on clicking on any of them you will be presented with a pop up showing the name organization and node name
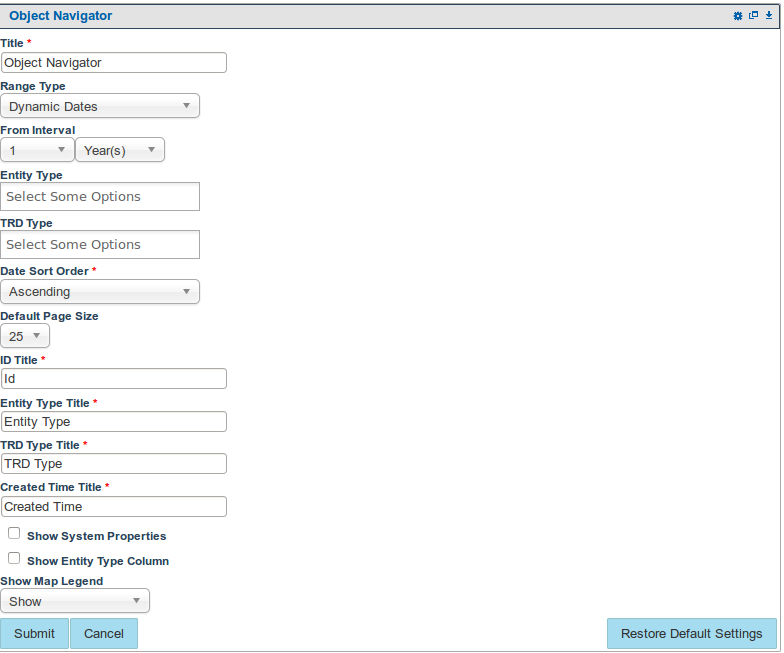
A legend is displayed when color attributes for markers are set, this legend can be hidden with the option from the widget configuration.

Note
- The colors of the markers on the map can be changed, please contact your administrator if you wish to.
- The arrowheads in the map shows the where a shipment was sent to
Legend
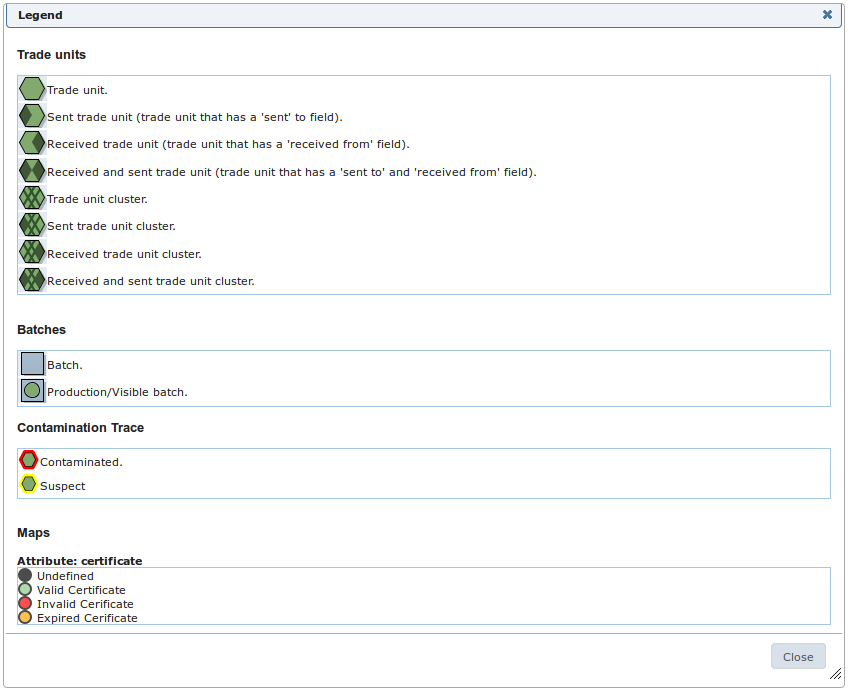
When a graph is loaded, Clicking on the Legend button loads a pop-up that explains the graph notations, as shown below:
DSB Message
It is important to note that if the current logged-in user's organization is of a Down Stream Basic (DSB) type, then the user is not allowed to view the Internal Graph. In place, a message informing the user to upgrade their GTNet subscription is displayed.

Information Tables
Details
Shows the object details and properties. The details section is divided to 3 sections System properties (TRD meta data), Event properties and Master Data attributes
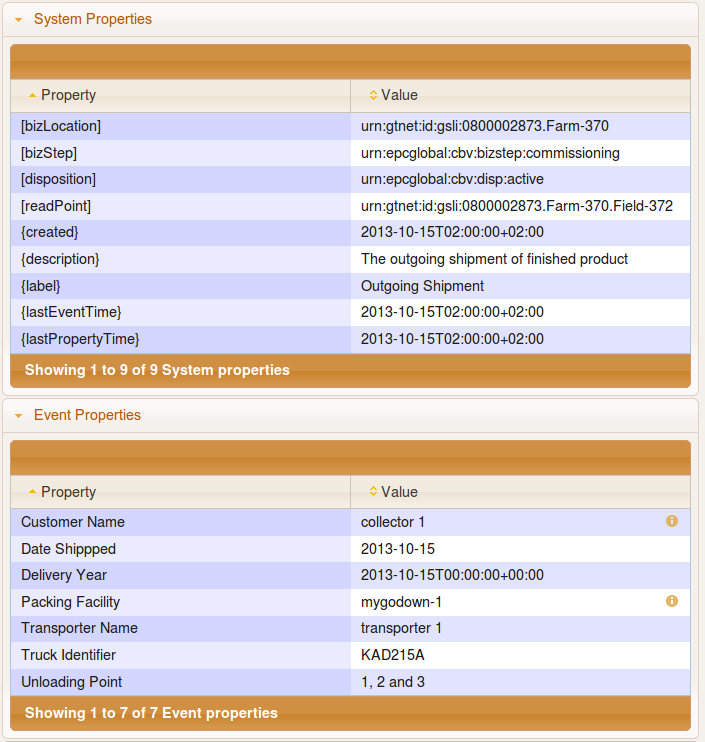
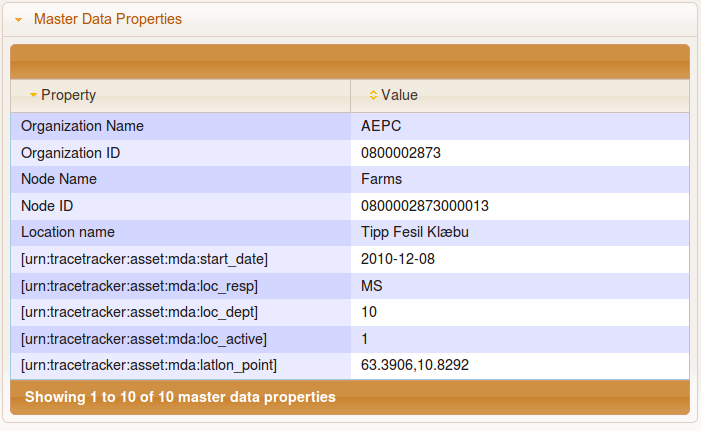
- URL(s) appear hyperlinked and are clickable. This applies to all forms of urls e.g. http, https, www, ftp, etc.
- Geo-coordinates also appear as links to Google Maps
Note
The properties in curly braces {} and square brackets [] are only displayed if the property show system properties is enabled in the widget settings
The small icon  that may appear next to a property value provides more details about the value
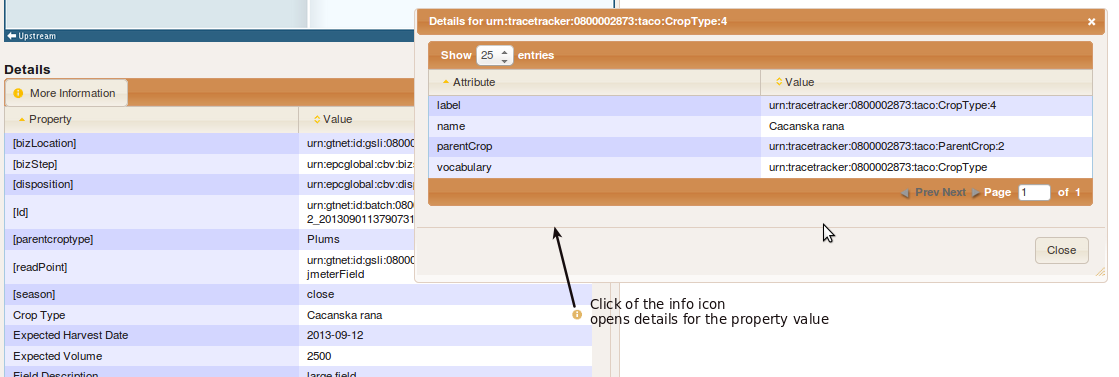
Information button
The "More Information" button  found next to the title of the "Details" table opens up a link on a new tab, providing more details. The link/url is defined in the specific organization's vocabulary.
Note
The More Information button is only displayed when the target URL is defined in the organization's vocabulary.
Note
The tables Transformations, Deliveries, Events which appear just below Details are expandable and collapsable. When you expand or collapse them, the open-closed state of each panel is saved on the dashboard. That way, when you switch between shipment you see the same panels open or closed based on your last selection.
Transformations
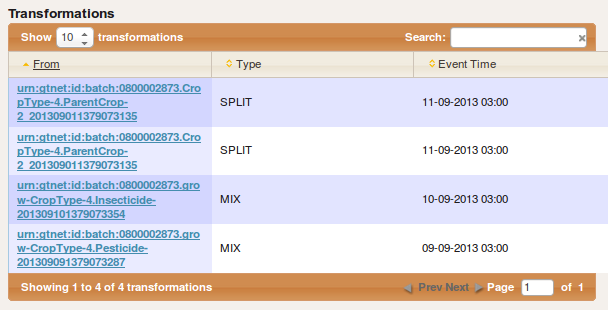
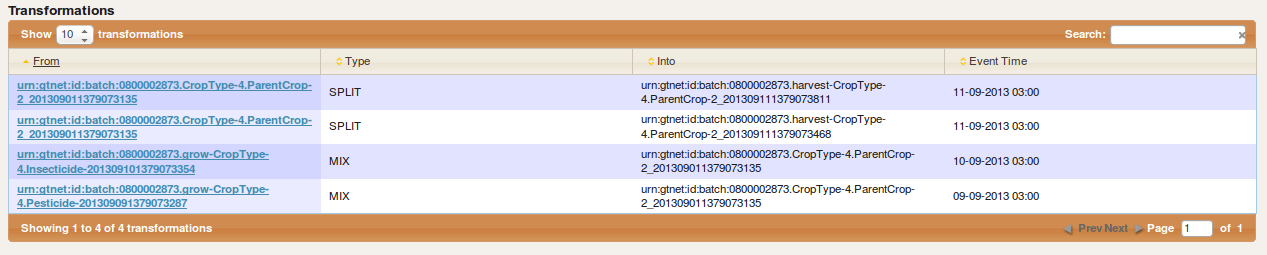
Shows the transformation events related to the epc Id
It has two mode when normal widget view and maximized view
Clicking on the from Id will load the graph and details for it
when maximized
Deliveries
Shows the incoming or out going shipment details

Events
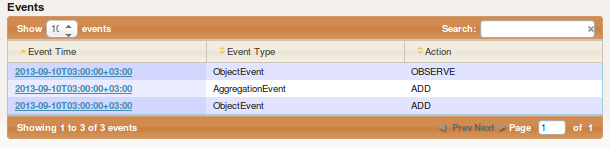
Shows the events related to the Ids
It also has two modes, normal widget mode and maximized
When maximized

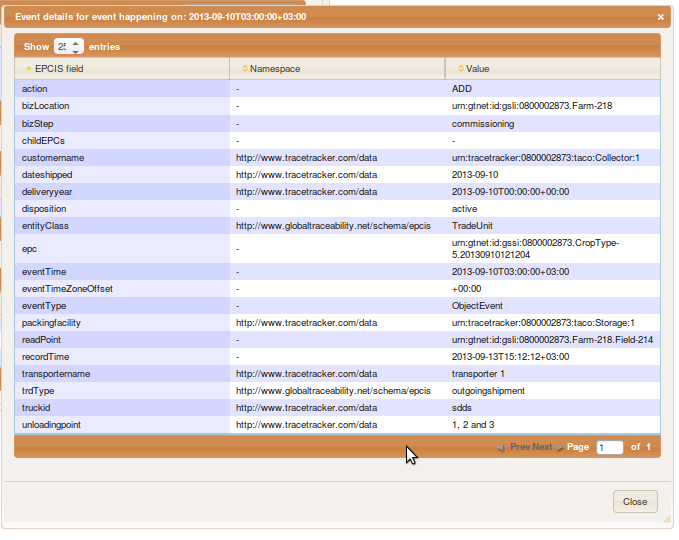
On click of the event time on the events table pops up more details for the selected event.
Graph History
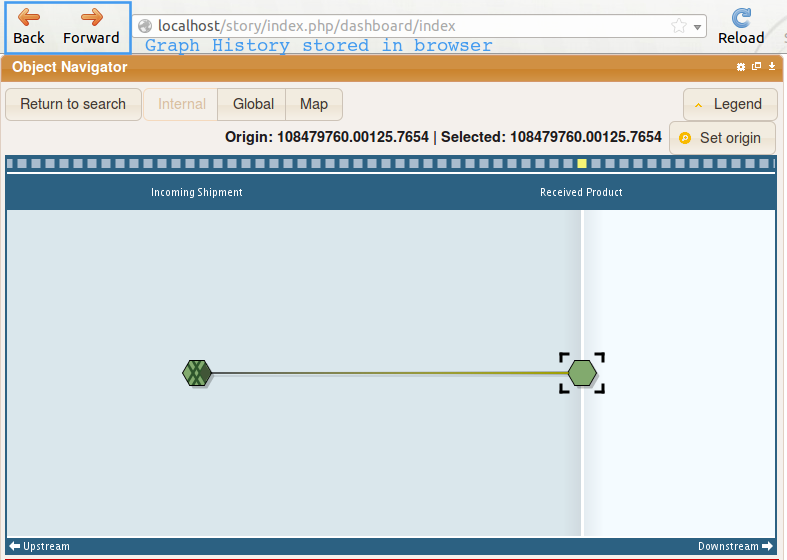
When interacting with the graph, selecting items from the listing, change focus or change origin for internal or global graphs,
- History will be created on the browser, to go back or forward through the interactions click on the back or forward buttons of the browser.
Configuration
These are the different option in the configuration of the widget that can be applied for the listing tab
Graph Localization
The graph can be displayed in the locale selected by the user on the user preferences page (User Preferences Page). This works provided that the locale selected is supported by the TIX.